5. Pivot Tables
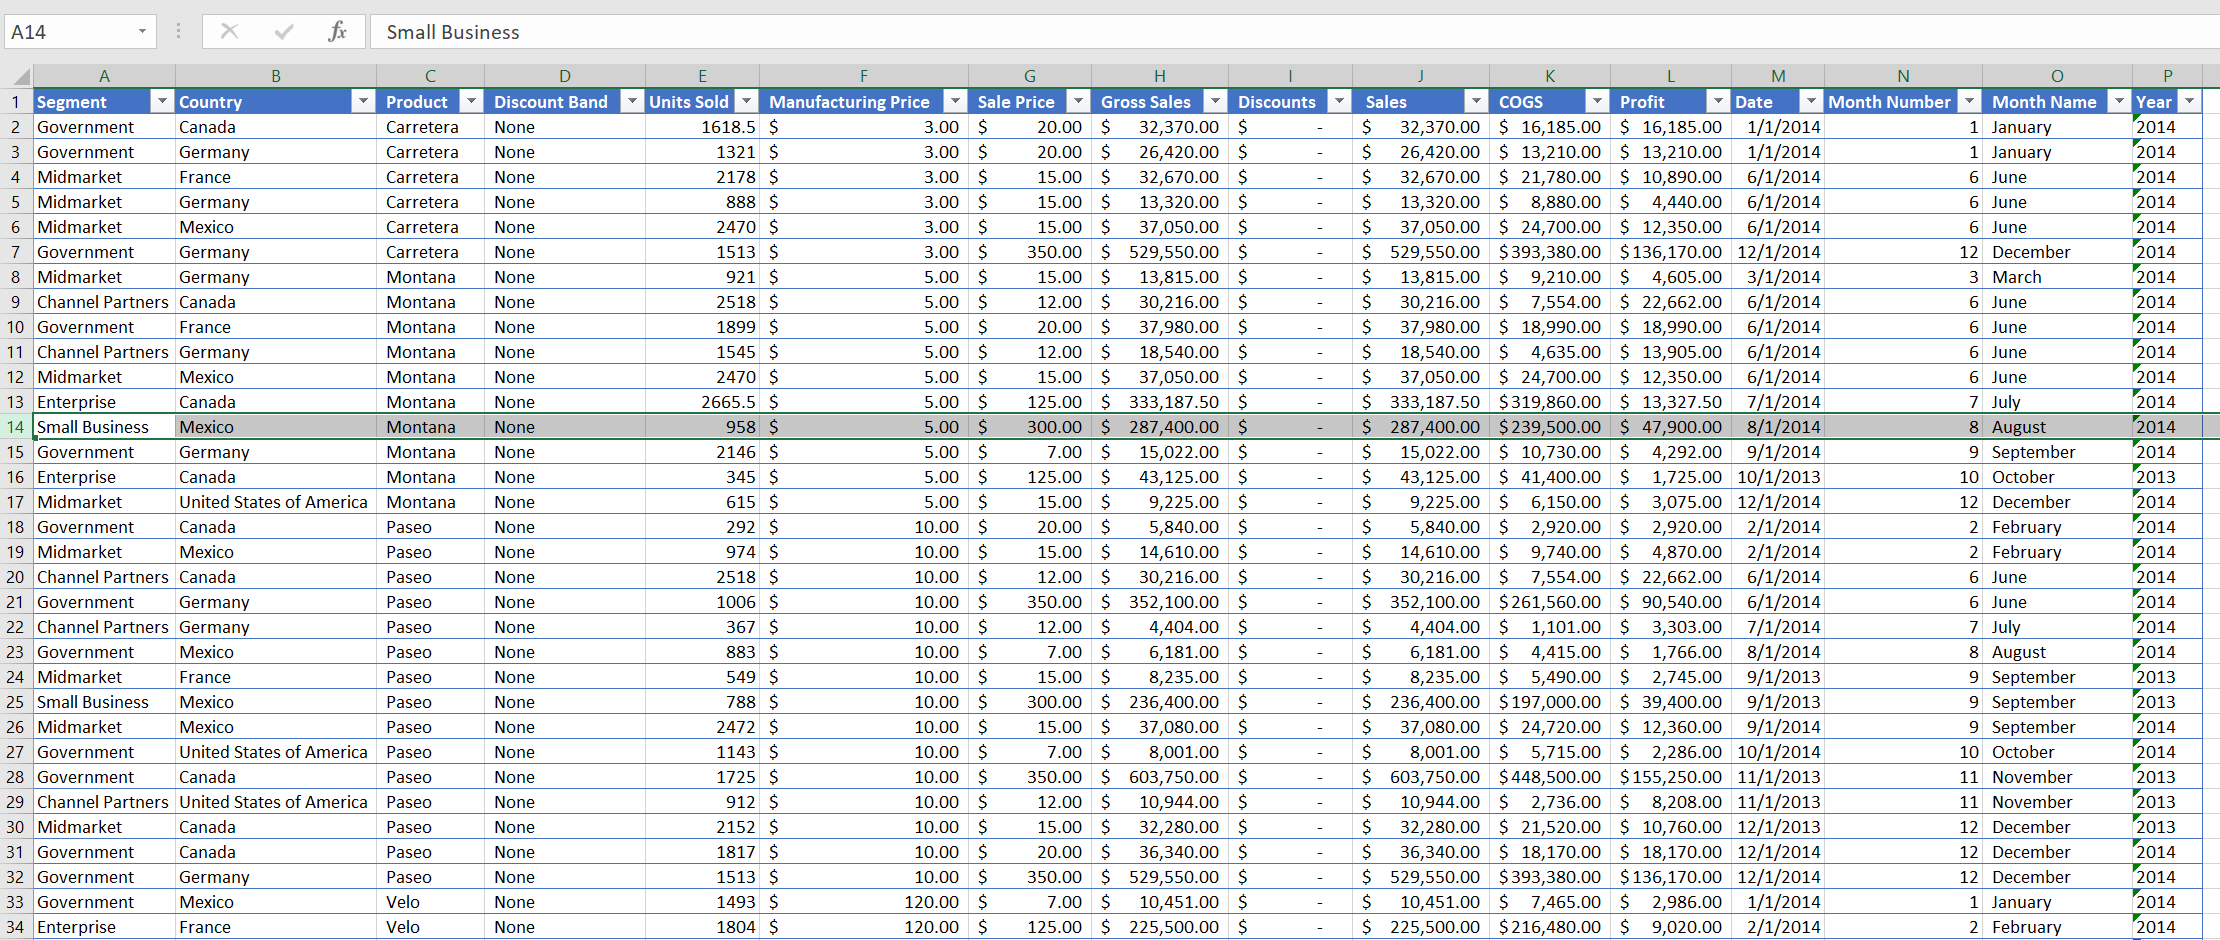
Pivot tables allow users to summarize data. They are generally used on large sets of data. An advantage of using a pivot table is that users do not have to deal with formulas or functions to create it. The figure below is a large data set will be used to create the pivot table.
Start by selecting any cell in the data set and then pressing Alt, n, and v. A
Create PivotTable dialogue box will pop up.
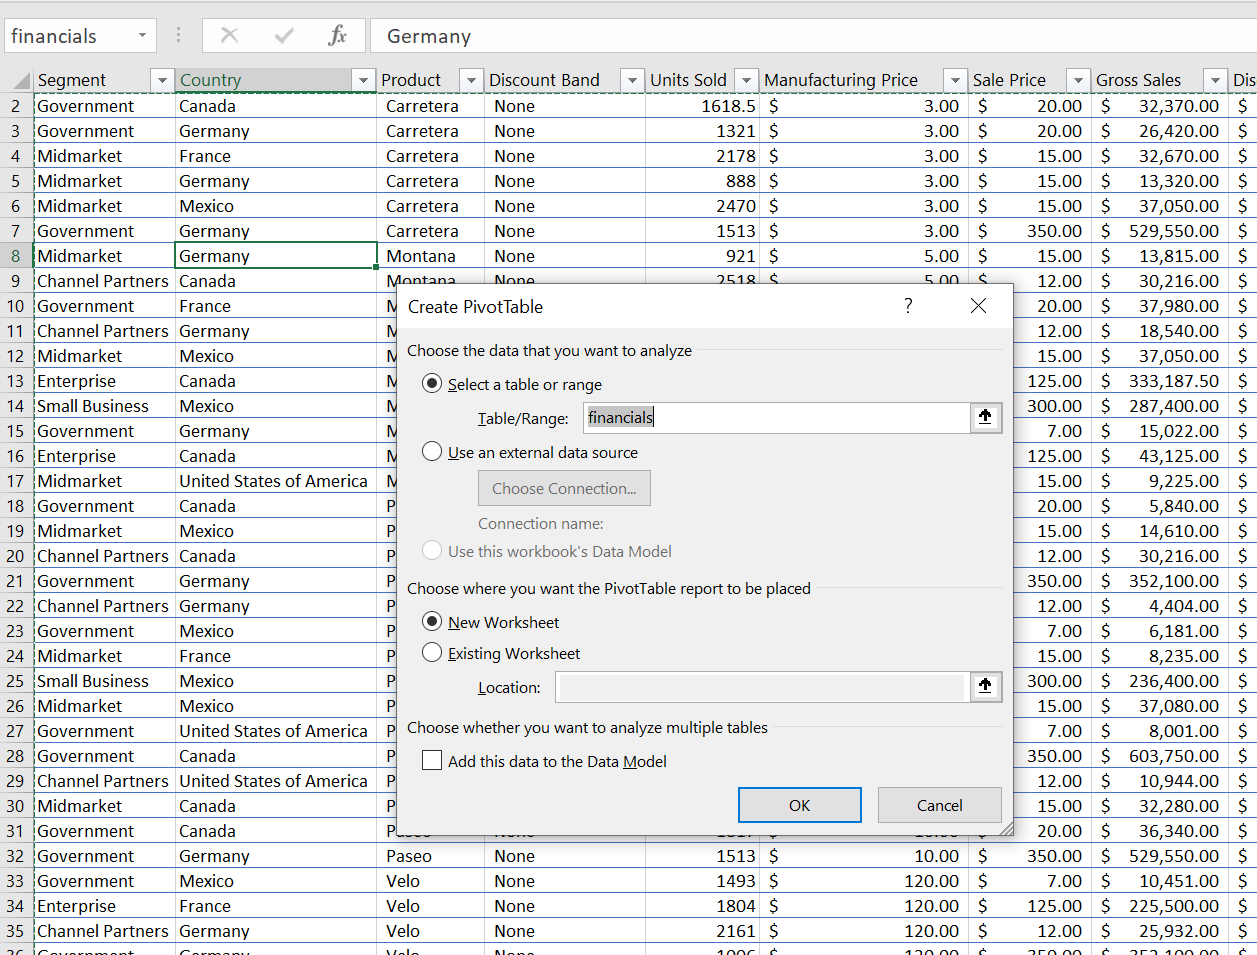
Observe the Table/Range: is automatically filled in with the financials and selects all the data in
that worksheet. In the Choose where you want the PivotTable report to be placed portion of the
dialogue box, a location in the current worksheet can be chosen or a new worksheet can be chosen. For
this example, New Worksheet will be picked. Click on Ok and the wizard for the PivotTable will
be created.
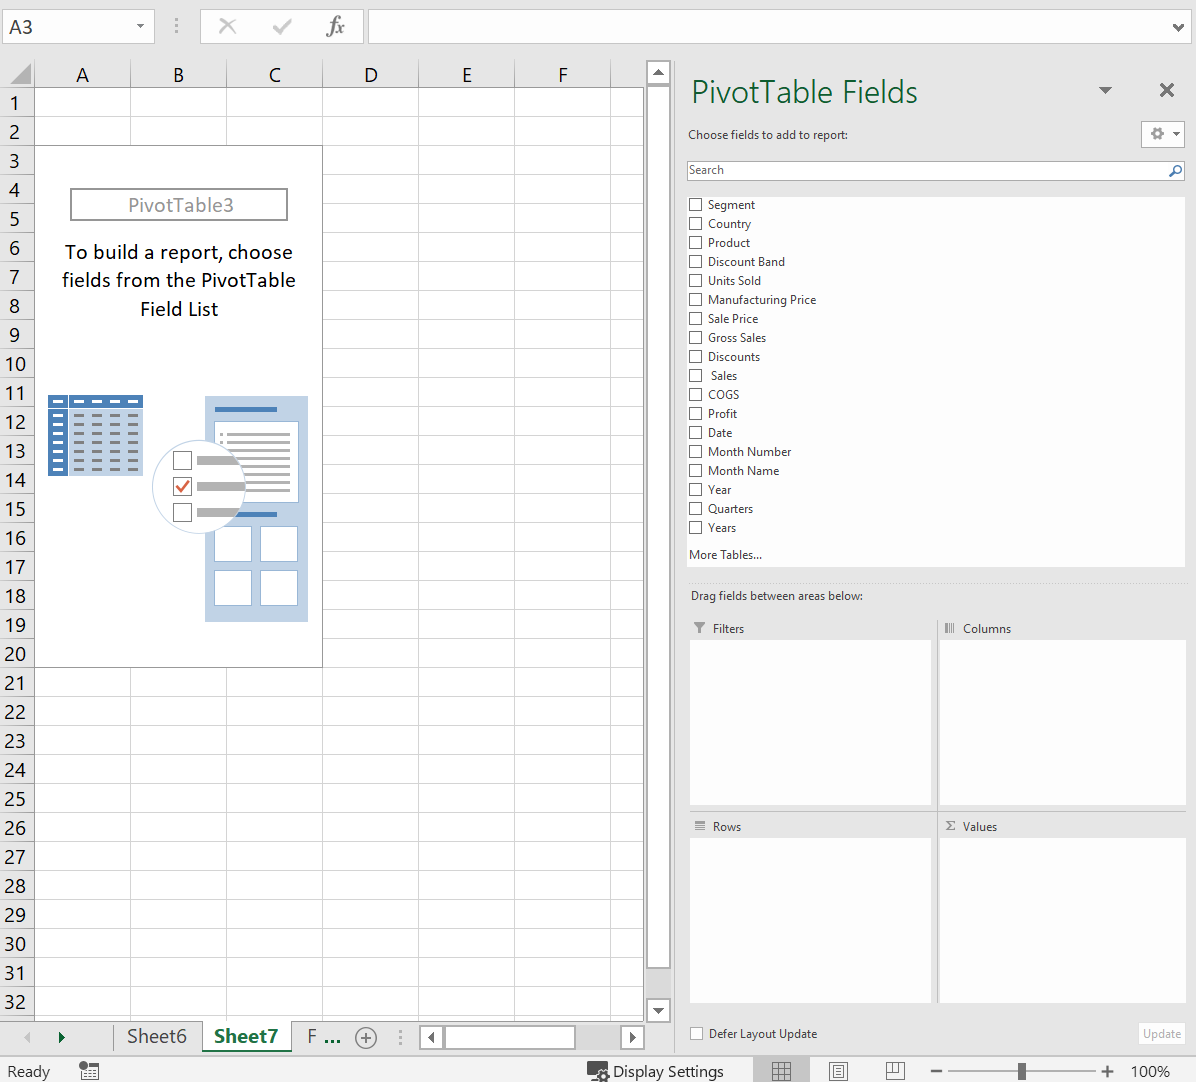
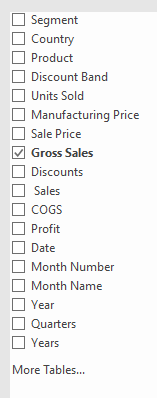
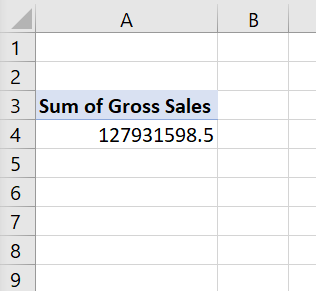
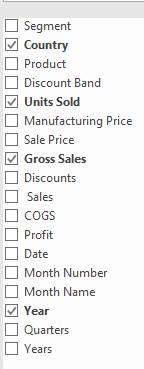
On the right side, the fields can be selected by checking them. Start by checking Gross Sales.
Observe that Excel automatically places it in the Sum Values box and then creates a small 2 rows by 1
column table in the worksheet.

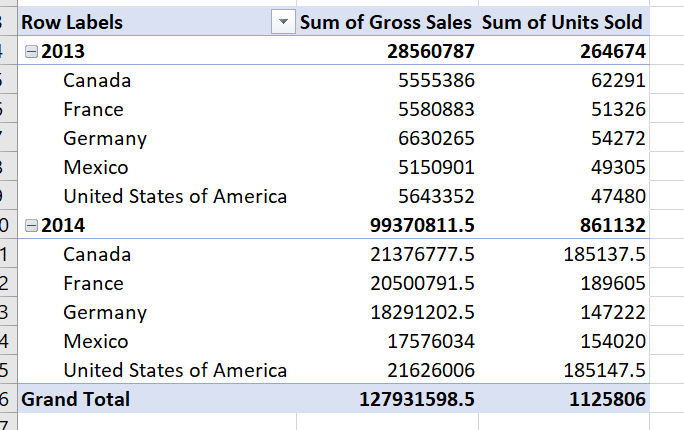
Next, check Country, Units Sold, and Year. Observe where Excel places these selections and
how the table transforms as they are checked.
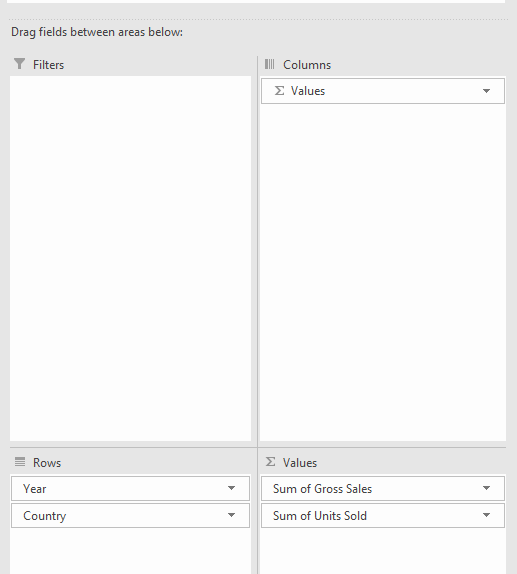
Play around with the fields and moving the fields to the Filters, Columns, Rows, and
Sum Values areas to see how the pivot table adjusts. A pivot table is a powerful tool that allows
users to quickly create meaningful summaries of large data sets.